Assessing profitability with the BCG Matrix
Note: This post is developing the train of thought of the On Software Product Strategy post.
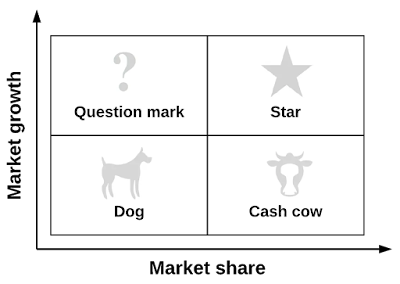
From business point of view, it is important to understand which stage the products or services have reached which can be assessed in terms of market share and growth using the BCG matrix (or Boston Consulting Group) model (see Fig.1). The BCG matrix is a corporate planning tool, which is used to classify a product into four categories along relative market share axis (horizontal axis) and speed of market growth (vertical axis) axis. These two dimensions reveal likely profitability of the business in terms of cash needed to support the product and cash generated by it [1].
 |
| BCG Matrix. (Based on [1]). |
There are four quadrants into which products are classified:
- Question marks: hold low market share in fast growing markets consuming large amount of cash and incurring losses.
- Stars: operate in high growth markets and maintain high market share as well. Stars are both cash generators and cash users. These are the primary products in which the company should invest money, because they are expected to become cash cows and generate positive cash flows.
- Cash cows: are the most profitable products and should be kept to provide as much cash as possible. The gained cash should be invested into stars to support their further growth.
- Dogs: hold low market share compared to competitors and operate in a slowly growing market. They are not worth investing in because they generate low or negative cash returns.
References
[1] Vaughan Evans. 25 Need-to-Know Strategy Tools. FT Publishing International, 2014.


